Website and Source code
The funStatTest package implements various statistics for two sample comparison testing regarding functional data introduced and used in Smida et al 2022 [1].
This package is developed by:
Installation
To install the funStatTest package, you can run:
install.packages("funStatTest")You can also install the development version of funStatTest with the following command:
remotes::install_git("https://plmlab.math.cnrs.fr/gdurif/funStatTest")Documentation
See the package vignette and function manuals for more details about the package usage.
Development
The funStatTest was developed using the fusen package [2]. See in the dev sub-directory in the package sources for more information, in particular:
- the file
dev/dev_history.Rmddescribing the development process - the file
dev/flat_package.Rmddefining the major package functions (from which the vignette is extracted) - the file
dev/flat_internal.Rmddefining package internal functions
The funStatTest website was generated using the pkgdown package [3].
Example
This is a basic example which shows you how to solve a common problem:
Data simulation
We simulate two samples of trajectories diverging by a delta function.
simu_data <- simul_data(
    n_point = 100, n_obs1 = 50, n_obs2 = 75, c_val = 10,
    delta_shape = "quadratic", distrib = "normal"
)

plot_simu(simu_data)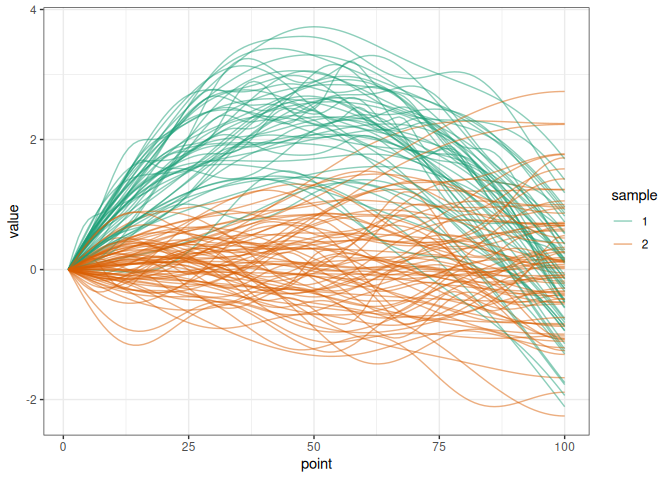
We extract the matrices of trajectories associated to each sample:
MatX <- simu_data$mat_sample1
MatY <- simu_data$mat_sample2
And we compute the different statistics for two sample function data comparison presented in Smida et al 2022 [1]:
res <- comp_stat(MatX, MatY, stat = c("mo", "med", "wmw", "hkr", "cff"))
res
#> $mo
#> [1] 0.9436923
#>
#> $med
#> [1] 0.9469112
#>
#> $wmw
#> [1] 0.8940712
#>
#> $hkr
#>            [,1]
#> T1 2.548804e+08
#> T2 7.546891e+03
#>
#> $cff
#> [1] 12578.81
We can also compute p-values associated to these statistics:
# small data for the example
simu_data <- simul_data(
    n_point = 20, n_obs1 = 4, n_obs2 = 5, c_val = 10,
    delta_shape = "constant", distrib = "normal"
)

MatX <- simu_data$mat_sample1
MatY <- simu_data$mat_sample2

res <- permut_pval(
    MatX, MatY, n_perm = 200, stat = c("mo", "med", "wmw", "hkr", "cff"),
    verbose = TRUE)
res
#> $mo
#> [1] 0.009950249
#>
#> $med
#> [1] 0.009950249
#>
#> $wmw
#> [1] 0.009950249
#>
#> $hkr
#>          T1          T2
#> 0.009950249 0.009950249
#>
#> $cff
#> [1] 0.009950249
⚠️ computing p-values based on permutations may take some time (for large data or when using a large number of simulations. ⚠️
And we can also run a simulation-based power analysis:
# simulate a few small data for the example
res <- power_exp(
    n_simu = 20, alpha = 0.05, n_perm = 200,
    stat = c("mo", "med", "wmw", "hkr", "cff"),
    n_point = 25, n_obs1 = 4, n_obs2 = 5, c_val = 10, delta_shape = "constant",
    distrib = "normal", max_iter = 10000, verbose = FALSE
)
res$power_res
#> $mo
#> [1] 1
#>
#> $med
#> [1] 1
#>
#> $wmw
#> [1] 1
#>
#> $hkr
#> T1 T2
#>  1  1
#>
#> $cff
#> [1] 1